Directivity plots
The values on the directivity plot are generally standardised by a particular value (usually the highest value in the response). The quantities can be explained with linear or logarithmic units (
|
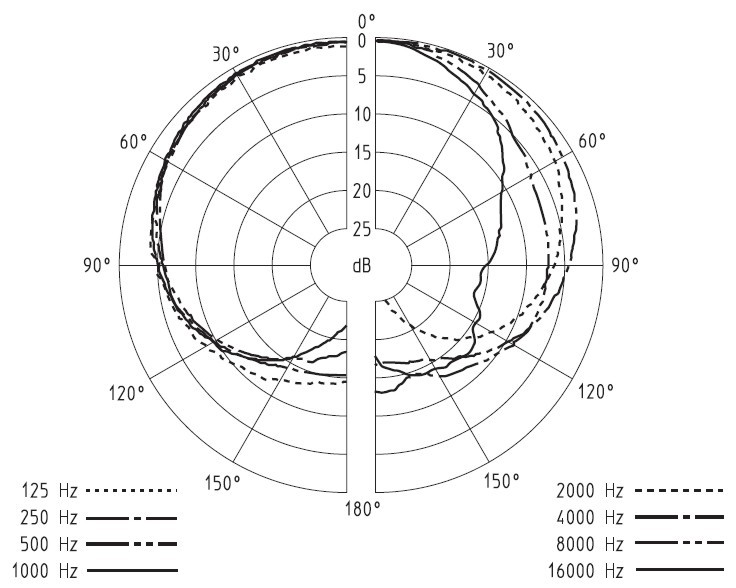
Directivity of a Sennheiser microphone for different frequencies |